In 1970s, a professional trader Richard Donchian created the indicator which was successfully adopted to the foreign exchange market and binary options. Despite being a well-known indicator, the Donchian Channel is not standard but used as a custom indicator. If you want to enhance your trading, look into its strengths and learn how to use it.
Successful trading of binary options is based on price prediction. If you can determine the trend and anticipate a reversal, you will make money in the financial markets. Traders use many different tools and indicators. Some traders love to use Donchian Channel tool because it visually “draws” the upper and lower boundaries of the trend. Trades can navigate in the current market situation to make the right decision.
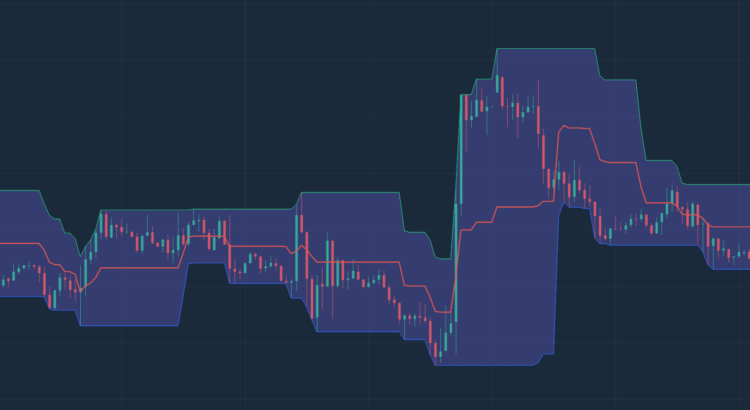
Even though Donchian Channel predates Bollinger Bands, it is underrated. Only advanced traders have it in trading terminals. Fortunately, Pocket Option offers Donchian Channel among the standard tools. See how it looks on the screenshot below.
More on the Donchian Channel: How it Works?
The Donchian channel indicator is a great help in trading. It is easy to understand and use as a successful trading strategy. Before we discuss it, let’s break the Donchian channel indicator. It takes a customized number of periods to calculate the upper and lower bands. First of all, the upper line is the highest price for the last n period. Secondly, the lower line is the lowest price for the last n period.
Traditionally, the default value for n is usually set as 20. You can set it at whatever value you prefer.
When you look at the chart, you see that Donchian Channel looks like Bollinger Bands. However, in the Donchian the candles stay inside the boundaries of the channel.

Unlike Bollinger, the Donchian is built solely on average indicators of the maximum and minimum price values.
If you want to customize and set your parameters for the Donchian Channel in the Pocket Option terminal, click on the pencil icon next to the indicator name to do it.
A new window will open, and you will be able to customize the settings for the lines and the channel. You can change color, parameters, and other settings.
How to Trade Binary Options using the Donchian Channels?
As mentioned before, the Donchian Channel is a trend indicator intended for trading in the direction of the trend. However, it can also be used in flat market, which gives an additional opportunity to profit on binary options.
As a rule, the price oscillates from the upper to the lower border of the channel. The ideal signal for buying a contract in the flat market is when the lines intersect.
Buy a CALL option when lines move up to the next candle. Buy a PUT option, when the line breaks down.

To determine the trend use the Donchian Channels check if the channel moves up and the candles are located in the upper half of the channel. If yes, it means there is a steady upward trend in the market.
Consequently,
- But a PUT contract with a downtrend when the price rebound from the central moving down;

- Buy a CALL during an upward movement when the price bounces from the midline up.

At the heart of the famous Turtle system is the Donchian channel indicator. The Turtles made a lot of money by exiting their trades using breakouts in the opposite direction, which allowed them to ride very long trends. Markets have changed a lot over the years, so even the Turtle strategy needs some serious modifications.
Now you know that the Donchian channel indicator is a simple but effective indicator that plots the highest high and the lowest low over a set period of time. It is also useful for identifying price breakouts and is used in some trend-following systems too.


