Fibonacci Retracements are a very useful tool in regular technical analysis.
So, how do to apply Fibonacci for trading binary options? The answer is simple: find potential areas for signals to form. Remember that Fibonacci is not really a signal; it is merely an estimation of where the market is likely to do something such as form a signal. What that something is will not be know until the market does it.
In 1202 Fibonacci described the sequence of numbers: after 0 and 1, each number is the sum of the two prior numbers. Each number is approximately 1.618 times greater than the preceding number. Fibonacci did not know that it would be used in trading strategies to identify reversals and trends.
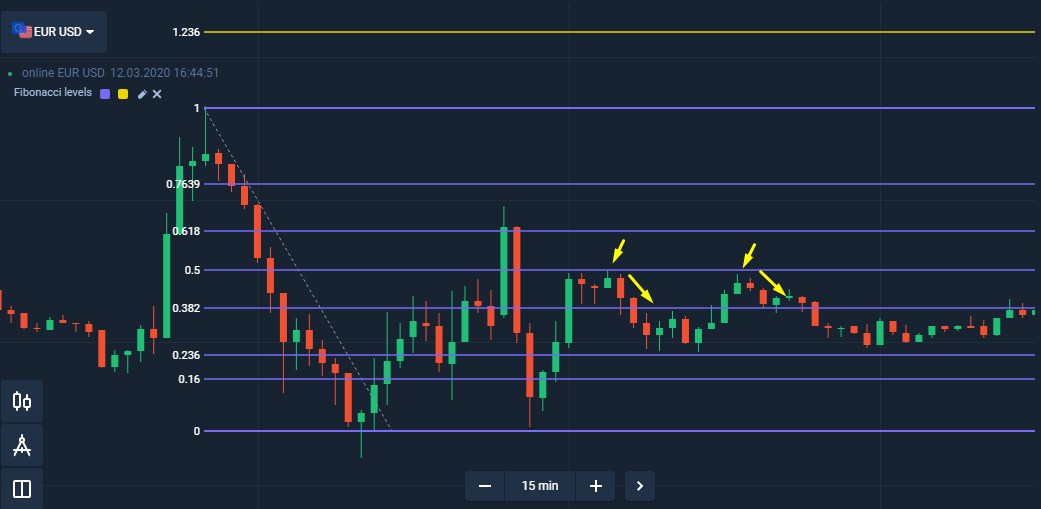
Everything in the financial market changes the price and traders make money or lose money depending on the changes. However, the rollback of prices in the opposite direction does not always mean the end of the current trend. In the context of trading the levels in Fibonacci retracement are not numbers in the sequence; instead, they are derived from mathematical relationships between numbers in the sequence. The basis of the “golden” Fibonacci ratio of 61.8% comes from dividing a number in the Fibonacci series by the number that follows it. Fibonacci levels are depicted in high and low points. The horizontal lines of 23.6%, 38.2%, and 61.8% are used to identify possible price reversal points.
If you trade in Pocket Option platform, you can find it in the “Indicators” menu.
Fibonacci Retracement Levels in a Trading Strategy
The Fibonacci Levels is a unique tool: each subsequent number in it is equal to the sum of the two previous ones. The Golden Ratio is 1.618. It mysteriously appears frequently in the natural world, architecture, fine art, and biology. You can find it in the Parthenon, Leonardo da Vinci’s Mona Lisa, sunflowers, roses, shells, trees, faces, vases and galaxies. It is also used in trading. Fibonacci retracements are often used as part of trading strategy. In this scenario, traders observe a retracement within a trend and try to make low-risk entries in the direction of the initial trend using Fibonacci levels. Traders using this strategy anticipate that a price has a high probability of bouncing from the Fibonacci levels back in the direction of the initial trend.
If you want to position the tool on the chart:
- Click on Fibonacci in the “Indicators” menu.
- Double-click on the top (downward) or the bottom (upward) of the chart.
- Drag the white circle, set the value to 1 (beginning of correction or reversal).

Do not use Fibonacci retracement levels if the market is flat. It is good for volatile markets.
Using Fibonacci Retracement Levels Tool
Fibonacci retracements are used on a variety of financial instruments including stocks, commodities and foreign exchange. They are also used on multiple time frames. However, as with other technical indicators, the predictive value is proportional to the time frame used, with greater weight given to longer time frames.
Experts say that the level of 0.618 marks a correction. If the market touch this level and bounced, you can continue to trade in the direction of the current trend.

If the price trend continues through the level of 0.618, then it signals a change in the current trend. In this case, trend traders should stop buying contracts. It works for turbo contracts with the expiration more than the formation time of 1-2 candles.
While Fibonacci retracement levels can be used to forecast potential areas of support or resistance where traders can enter the market in hopes of catching the resumption of an initial trend, Fibonacci extensions can complement this strategy by giving traders Fibonacci-based profit targets. Fibonacci extensions consist of levels drawn beyond the standard 100% level and can be used by traders to project areas that make good potential exits for their trades in the direction of the trend. The major Fibonacci extension levels are 161.8%, 261.8% and 423.6%.
Fibonacci retracement levels often mark reversal points with uncanny accuracy. The levels are best used as a tool within a broader strategy that looks for the confluence of several indicators to identify potential reversal areas offering low-risk, high-potential-reward trade entries.


