Traditionally, most trend indicators are located directly on the price chart. However, there is an exception to the rules. It is the Average Directional Index (ADX). It can remind you of an oscillator but it is an indicator.
ADX indicator helps traders determine the direction of the main trend, measure its strength so you can be confident when purchasing options.
The successful financier Wells Wilder created the indicator ADX. By the way, he also developed such well-known tools as Parabolic SAR and Relative Strength Index (RSI).
To use ADX in the terminal from Pocket Option, select it from the list and install it on the chart.
Average Directional Index Characteristics
You should know that before the Average Directional Index, Wilder developed and implemented 2 financial tools in trading:
- Positive Directional Indicator (+DI), designed to indicate the strength of the uptrend.
- Negative Directional Indicator (-DI), designed to indicate the downtrend.
In the ADX, Wilder combined the above indicators and added another ADX line to indicate a trend in the market at the moment and define its perspective.

Pocket Option gives you an option to fine-tune the ADX by using color and thickness of the line. We use the classical parameters proposed by Wells Wilder because they proved to be the most effective.
Understanding the ADX is rocket science. That is why it is very popular with novice traders. Let’s review the main rules:
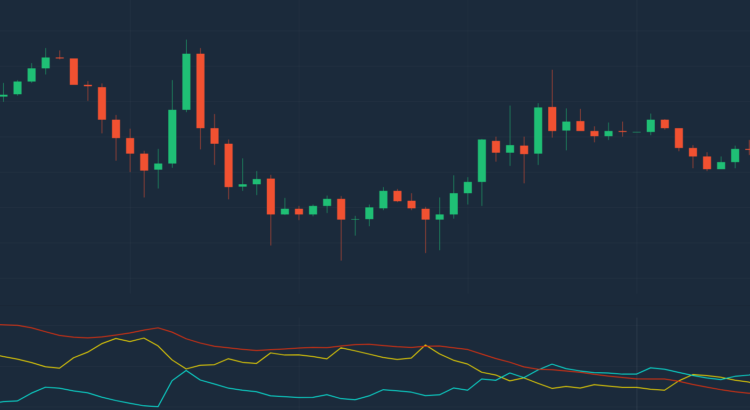
- If the blue line (+ DI) is located above the red (-DI) and they are located at a distance from each other, then there is a steady upward trend in the market. Otherwise, the opposite is true.
- If the curves constantly intersect or “stick together” – this indicates a flat.
- The ADX line (yellow) indicates volatility and, accordingly, the strength of the current trend. The higher it is, the more stable the movement.
How to trade using the Average Directional Index?
As you know, it is most profitable to open at the beginning of the trend, not at its end. Therefore, based on the indicator described above, the trading algorithm will look as follows:
- The CALL option is bought after the lines intersect and + DI is over -DI.

- The PUT option, by contrast, is bought when, after lines are crossing, -DI is already above + DI.

The ADX line will be your guidance star. The higher it is, the stronger the trend.
We recommended using this strategy on timeframes from H1 to D1.
The expiration period should be no less than the time of formation of 2 bars.
With the ADX you have an effective indicator at your disposal, so use it wisely. It gives you the high accuracy of signals in an instant. You can use it with other instruments or separately, it is truly a universal tool for making a profit in the financial markets.


