Throughout the history of financial markets, a diverse array of instruments has emerged, each serving distinct purposes such as indicating trend directions, signaling reversals, or assisting in identifying optimal entry points. In the realm of digital contracts, one particularly valuable indicator is the Average True Range (ATR). Its significance lies in its clear depiction of market volatility, providing traders with crucial insights into the potential movement of a given asset.
It’s important to note that in binary options trading, the extent of price changes is not the primary concern. Instead, the focus is on the fact of price movement and its direction. Whether the price moves significantly or not, understanding the direction is paramount.
For traders engaging in binary options based on specific impulses or trend movements, having assurance that such movements will persist until the expiration date is crucial. This is precisely where the Average True Range proves its utility. As an oscillator class indicator, ATR is conveniently included in the preinstalled tools of the Pocket Option terminal, offering traders valuable information to make informed decisions.
Description and Parameters for ATR
The creator of the indicator is the renowned financier Wells Wilder, who conceptualized a tool to provide insights into the prevailing volatility. Any experienced trader understands that the market exhibits undulating movements rather than a unidirectional flow. Even the most prolonged and stable price trends ultimately culminate in a phase of consolidation.
It’s noteworthy that whether a trend persists or undergoes a change, a spike in market volatility is observed. The ATR indicator, devised by Wilder, adeptly captures these fluctuations. Wilder gauges volatility through three methods: computing the disparity between the current high and low, between the previous closing price and the current low, or between the current high and the previous closing price.
The selection of the optimal calculation method depends on the market conditions, a consideration that held true in the era preceding the advent of Internet trading. Thankfully, in today’s context, there is no need for manual calculations. A simple click on the indicator’s name is sufficient to have it displayed on the workspace.
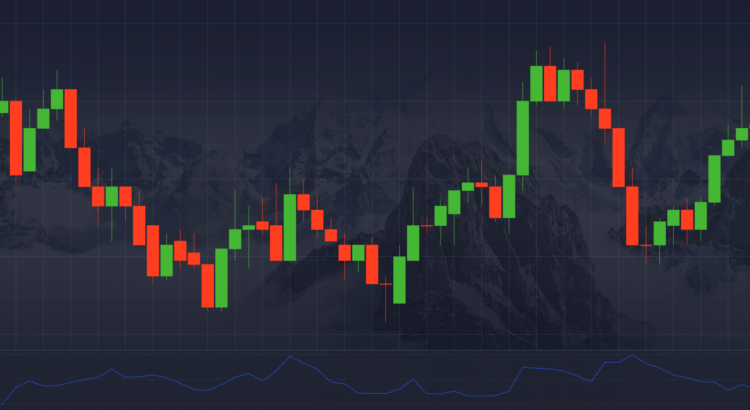
Average True Range is a scale with a signal line. Like all oscillators, it is located below the price chart.

The advisor’s creator recommends a setting of 14 for the period, irrespective of the trading timeframe. Nevertheless, certain traders opt to decrease the period value to 9 when operating on shorter time intervals. The indicator’s essence is straightforward – as the signal line value decreases, volatility decreases, and conversely, as it increases, volatility rises.
Given the above, the indicator proves beneficial in various scenarios. For instance, suppose you observe an impulsive movement along a trend and wish to purchase a short option to ride its continuation. However, there is uncertainty about the market potentially halting soon after your option purchase.
In such cases, the indicator becomes a valuable tool to assess volatility levels and make informed decisions regarding the optimal timing for entering the market.

Simply observe the ATR value to gauge the situation. If the ATR is at a high level and the line is trending upward, it suggests that the current movement holds potential.
In other scenarios, when actively trading with the trend and anticipating the next bounce from support, there might be uncertainty about whether it will result in a breakout. In such instances, it is advisable to consider the ATR. If the trend persists in its current direction, and the indicator reflects low volatility, it signals a probable reversal in the near future. This information becomes crucial for traders seeking to make well-informed decisions regarding market entry and exit points.

In the depicted scenario, entering the trend with the anticipation of an upward rebound resulted in the breakdown of the support line and a downward movement, potentially leading to losses. This underscores the importance of utilizing ATR as a valuable tool. However, for comprehensive options trading, it is evident that ATR should be employed in conjunction with other advisors.
The integration of ATR with complementary tools and strategies enhances the trader’s ability to make more robust and well-informed decisions. This combination allows for a more comprehensive analysis of market conditions, thereby reducing the risk of adverse outcomes and optimizing the potential for successful options trading.
In conclusion, the ATR (Average True Range) proves to be a highly valuable tool for traders in assessing market volatility and making informed decisions. The visual representation of volatility through the ATR line aids in identifying potential movements and helps traders navigate various scenarios, such as trend reversals and breakout situations. However, it is essential to recognize that ATR is most effective when used in tandem with other advisors and strategies. The depicted example highlights the potential pitfalls of relying solely on ATR, emphasizing the need for a comprehensive approach to options trading that incorporates a diverse set of indicators and analyses. By integrating ATR with complementary tools, traders can enhance their risk management and decision-making capabilities, ultimately contributing to a more robust and successful trading strategy.


