The CCI indicator stands for commodity channel index is a momentum-based indicator and belongs to the oscillator group of technical indicators.
Every trader (a beginner or an expert) knows the importance of trends. They are right. For decades, investors have been making their profits in the financial markets by determining the upcoming trends.
You should know that the market is of great importance when you open a position. It is also crucial to know when is the time to enter the transaction. Be aware of a U-turns otherwise you will end up in losses.
Even though traders use many indicators to help them to predict the trend, they consider CCI as one of the most effective tools. A successful trader D. Lambert introduced this indicator in the late1980s and it gained traction in commodity exchanges. D. Lambert developed the commodity channel index to identify the cycles in the commodity markets. As a momentum based indicator, the CCI index belongs to the oscillator group of indicators.
CCI widened its reach and applications since its introduction. It is often applied for electronic contracts.
You will find CCI among the standard indicators in the Pocket Option platform.
CCI Settings
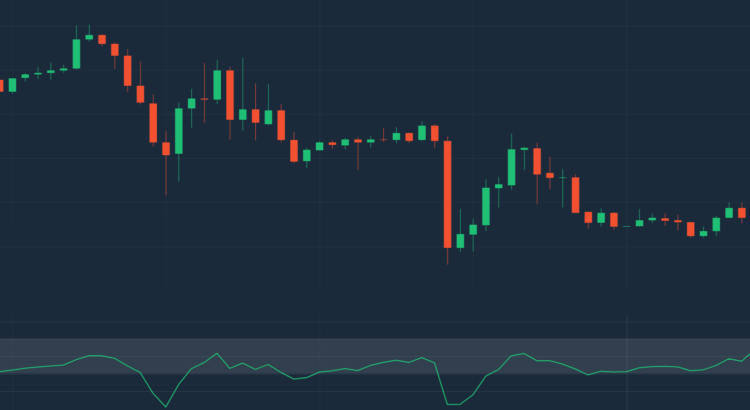
Since CCI is a classical tool, it is shown in a separate tab under the price chart. The CCI indicator simply calculates and visually depicts how fast prices are rising or falling. The speed at which the price of a security rises or falls will tell you whether price will continue moving in that direction or not.
It represents one moving average between the levels of -200, -100, 0, 100 and 200.

If you want to use this indicator, use it to evaluate the trend. Look at the line in the intervals:
- -200 to -100 indicates a down trend
- 100 to 200 indicates a steady uptrend.
If you see a line moving between -100 and 100 in the opposite direction (towards 0), it indicates the reversal of the general trend. It is a signal to open a deal.
As for the settings, CCI should be used in selected timeframe. In other words, if you trade by the hour (60 minutes), then the indicator period must be set to 20 min.
If the interval is longer, it leads to a decrease in the volatility and, as a result, to a decrease in signals. And, if, on the contrary, the interval is shorter, then there will be more signals, but they will be less accurate.
We recommend following to the parameters proposed by Lambert.
Contract Trading Using CCI
As mentioned above, the main signal for buying an option is a change in trend.
We recommended purchasing Call at the moment when the line crosses the level of -100 in the upward direction.

It is recommended to execute Put, when the indicator crosses 100 on its way down.

The expiration should be equal to the formation time of 2-3 candles.
For example, if you trade on a 15-minute timeframe, then the contract should be valid for 30 to 45 minutes.
Conclusion
As described in this article, the CCI indicator is a powerful tool that traders can use as part of their technical approach. Having a good understanding of how to use a cci trading strategy can help traders in many ways. First of all, you don’t have to look at adding more redundant indicators to your chart as we have learned how the cci calculation is done.
In general, the CCI shows the overbought and oversold conditions. Thanks to the algorithm invented by the author, it does not lag and gives a minimum of false signals. Many beginners in trading usually apply a technical indicator using a uniform set of rules.


