The article is about Williams % R indicator, its definition, application and advice for Pocket Option users.
What is the Williams Range?
Many traders love the Williams %R (Williams Percent Range), one of the technical analysis oscillators used to define entry and exit points in the market. Sometimes, it is referred to as %R. Its primary function is to compare a stock’s closing price to the high-low range over a specific period, typically 14 days or periods.
A successful publisher and promoter of trading materials Larry Williams developed it. He used it to receive to receive a record profit from trading futures in the amount of 11,000% of the initial investment. Larry Williams recommends using the tool on time frames from h1 and higher. He recommended the signal line of 14 bars .
How to customize the Williams Range at the Pocket Option platform?
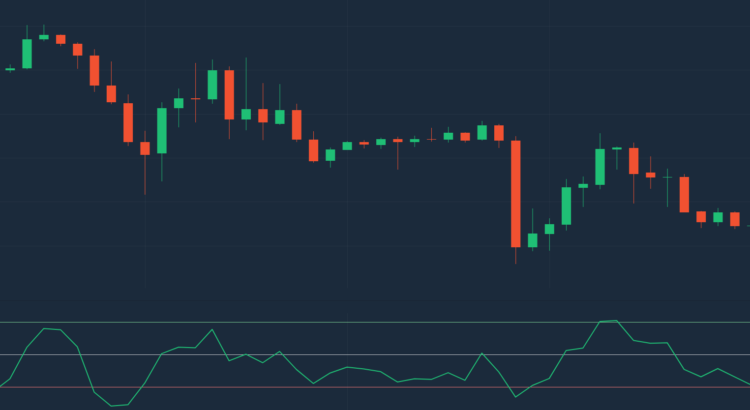
Similar to Stochastic Oscillator, the Williams% R is used for determining if the market is overbought and oversold. It indicates the progression or reversal of the trend. When the indicator is between -20 and zero the price is overbought, or near the high of its recent price range. When the indicator is between -80 and -100 the price is oversold, or far from the high of its recent range.
Williams Range represents a moving average and it can cross the above-mentioned levels. Usually, it is presented in the separate window at the pricing chart. Trading at Pocket Option, you can customize your settings by clicking on icon of the pencil located in the right corner of the screen.
You can set the period of the moving average and adjust the levels. You can choose its appearance: lines, histograms, areas or points.
How to use Williams Percent Range?
This oscillator can demonstrate the attenuation or reversal of the current trend. It also can signal for right time to the purchase contract. For example , if the signal line at the time of the rising trend is above the level of -20, it means the oversaturation of the market and high probability of reversal. When you see that the average is below the level -80, it means a downward trend.
If the market is flat, use the indicator to determine when to act. During an uptrend, watch for the indicator to move below -80. When the price starts moving up, and the indicator moves back above -80, it could signal that the uptrend in price is starting again. During the downtrend, watch for the indicator to move above -20, it is a signal a potential continuation of the downtrend.

Traders can also watch for failures. During a strong uptrend, the price will often reach -20 or above. If the indicator falls, and then can’t get back above -20 before falling again, that signals that the upward price momentum is in trouble and a bigger price decline could follow.

Conclusion: As you see, the Williams % the R is an effective tool to generate trade signals when the price and the indicator move out of overbought or oversold. Remember, that overbought or oversold readings don’t mean the price will reverse. Overbought simply means the price is near the highs of its recent range, and oversold means the price is in the lower end of its recent range.


