The Stochastic Indicator is a momentum indicator that trading experts often call “the cornerstone of the strategy,” because it shows the position of the most recent closing price relative to the previous high-low range. The indicator measures momentum by comparing the closing price with the previous trading range over a specific period of time. There are many modifications, however the classic version of Stochastic very popular among traders.
A famous financier George C. Lane developed it in the 1950s. He invented a trading algorithm based on a “fixed momentum” to predict the future price of the stocks.
The main focus of Stochastic used to be on the stock market. Later, it was adopted by FOREX, and subsequently by electronic contracts. When you trade on the platform Pocket Option, you can apply a list of fine-tuned indicators.
Method and Applications
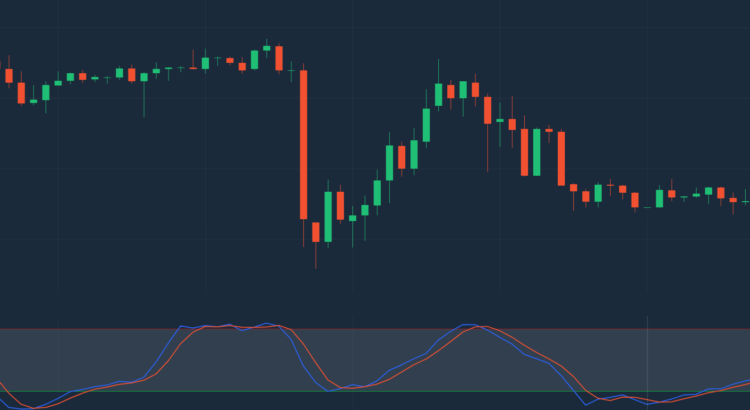
Like any indicators, Stoshastic is located under the chart in a separate window.

It consists of 4 horizontal levels: 0, 20, 80, 100 (some charts use an interval of 50). You will see two lines moving up and down. A reading above 80 is usually considered as overbought, while a reading below 20 is considered oversold. However, the price can remain in overbought and oversold conditions for a long period of time, especially during strong up- and downtrends.
A divergence occurs when the price “diverges” from the indicator, i.e. the price makes lower lows while the indicator makes higher lows, or the price makes higher highs while the indicator makes lower highs.
Areas between 0-20 and 80-100 refer to oversold and overbought markets respectively. Oversold market indicates that there is an excess of supply in the market and in the near future the price should turn around. Overbought markets are characterized by excessive demand, which indicates the fragility of the current trend.
The stochastic indicator is calculated using the following formula:
%K = (MostRecentClosingPrice – Lowest Low)/(HighestHigh – LowestLow) × 100
%D = 3-day SMA of %K
Lowest Low = lowest low of the specified time period
Highest High = highest high of the specified time period
The stochastic indicator is drawn with two lines on the chart; the indicator itself (%K) and a signal line (%D) which represents the 3-day simple moving average of %K. When these two lines cross, traders should look for an approaching trend change.
The% D line (red) is a simple moving average of %K.
A downward crossing of the %K-line through the signal line indicates that the current closing price is closer to the lowest low of the specified time period of the indicator than it has been in the previous three sessions. This is considered a bearish signal, while the opposite of this is considered bullish.
Your Pocket Option account is set to 14/3/3.
It is the best setting for time frames m30 – h4.
At lower intervals, it is recommended to reduce %K to 5. If you want to trade on frame from d1, the period %K and %D should be increased to 21 and 7, respectively. It will produce more accurate signals.
How to use Stochastic in electronic contracts
Watch out for the indicator in the “OVERBOUGHT” zones, so you will be able to anticipate the reversal of the current trend. It is a signal that you should purchase an option.
So, the PUT contract is recommended when the % K line leaves the overbought zone and crossed the 80th level from top to bottom.

And CALL contract is recommended, when the % K line leaves the oversold zone and crossed the 20th level from the bottom up.

Experienced traders often use the intersection of lines. In this case, the signal to buy the PUT option will be the intersection of the %K moving average from top to bottom with the %Kline. For the acquisition of CALL, look for the opposite situation. By using this strategy you can do successful scalping on lower timeframes.
Like most moving averages oscillators, Stochastic is able to accurately reflect the state of divergence. The stochastic indicator is widely used in the Forex community. It consists of two lines: the indicator line %K, and the signal or trigger line %D. The stochastic indicator can be used to identify oversold and overbought conditions, as well as to spot divergences between the price and the indicator.
The stochastic indicator is popularly used to trade oversold and overbought conditions, as well as bullish and bearish divergences.


