
The market has high inertial oscillations. This allows traders to successfully make profits under conditions of delayed signals from technical analysis systems. The degree of inertia depends directly on the strength of the initial impulse. We will now look at a simple 5-minute strategy that uses an impulse indicator as an additional MACD signal filter.
An overview of the indicators
MACD. This is a combination of fast and slow Moving Averages, complemented by a histogram that provides a visual factor of line divergence. It is a basic trend indicator that, in addition to reversal points of the market, allows you to determine the level of market volatility and recognize periods of divergence.
Momentum. One of the few tools that differs from the Moving Average on a fundamental level as it does not use averaging models. Its formula takes into account the rate of price change at the current moment relative to the same figure in the past. The greater the strength of the impulse, the higher the inertia of the market and, consequently, the greater the chance of closing the trade with a profit.
Trading platform settings
Trading is done on a 60-second interval with 5-minute trades. But if you choose CRYPTO ASSETS as your asset instead of a currency pair, then you can scale. By reducing the time frame from 60 to 15 seconds, and the expiration from 5 to 2 minutes, you will receive 2 times more signals. But their accuracy will remain at the same level only if the cryptocurrency index is used as the asset. The volatility of currency pairs does not allow for the formation of a full candlestick chart on small periods.
A step-by-step guide to setting up the Pocket Option terminal:
- Choose the first option offered in the list of assets that Pocket Option is currently showing the greatest profit on;
- Set the chart to the candlestick mode of price formation building and select the updating interval of 60 seconds;
- Add the MACD indicator, leaving the standard parameters, and Momentum, reducing the period from 14 to 8.
The money management rules for trading on the strategy are standard. The recommended value of one trading contract is 0.1-0.5% of the account balance. This is only possible if your capital amounts to $200-1,000. The upper limit is a 5% investment in the contract. Anyone can follow this rule and since the minimum transaction value on Pocket Option is $1, this requires a balance of only $20. Failure to comply with this simple requirement leads to an unacceptable increase in the risk of trading losses.
Trading signals on the strategy
The MACD with standard settings and Momentum with a period of 8 largely correlate with each other. If the discrepancy in time for the formation of signals does not exceed 3 minutes (6 candles), then this fits into the permissible limits.
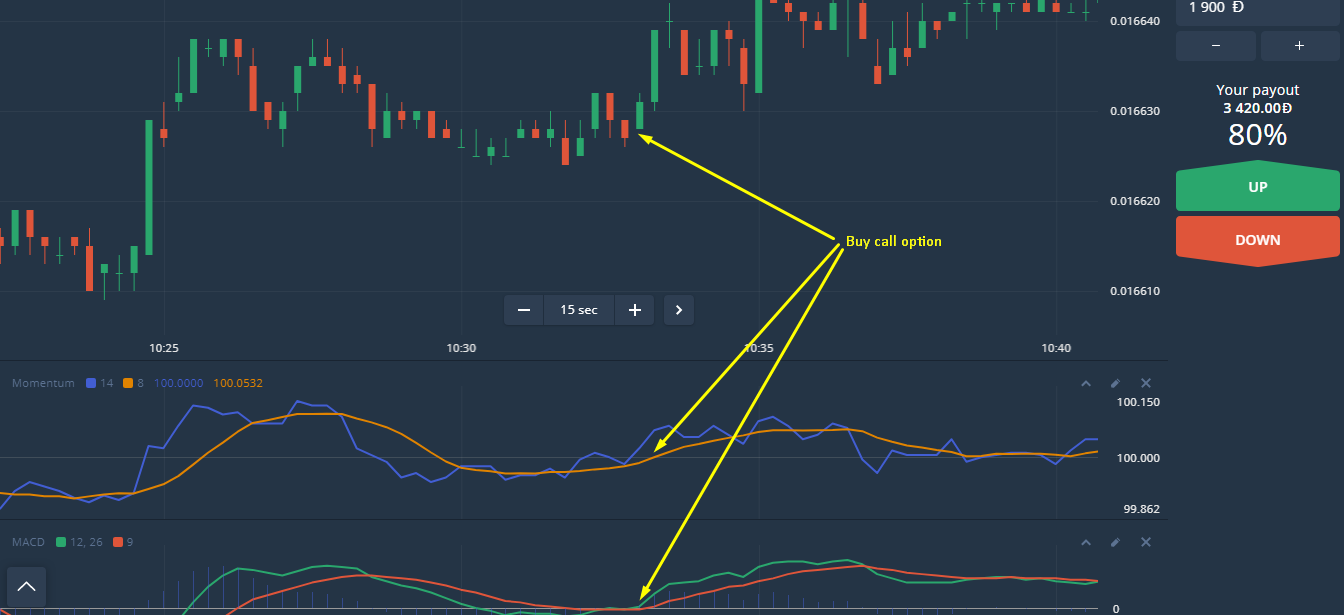
Buying a Call option – the intersection of the lines MACD and moving columns in the upper part, forming a confirmation with Momentum transitioning to the lower half of the window, the negative plane.
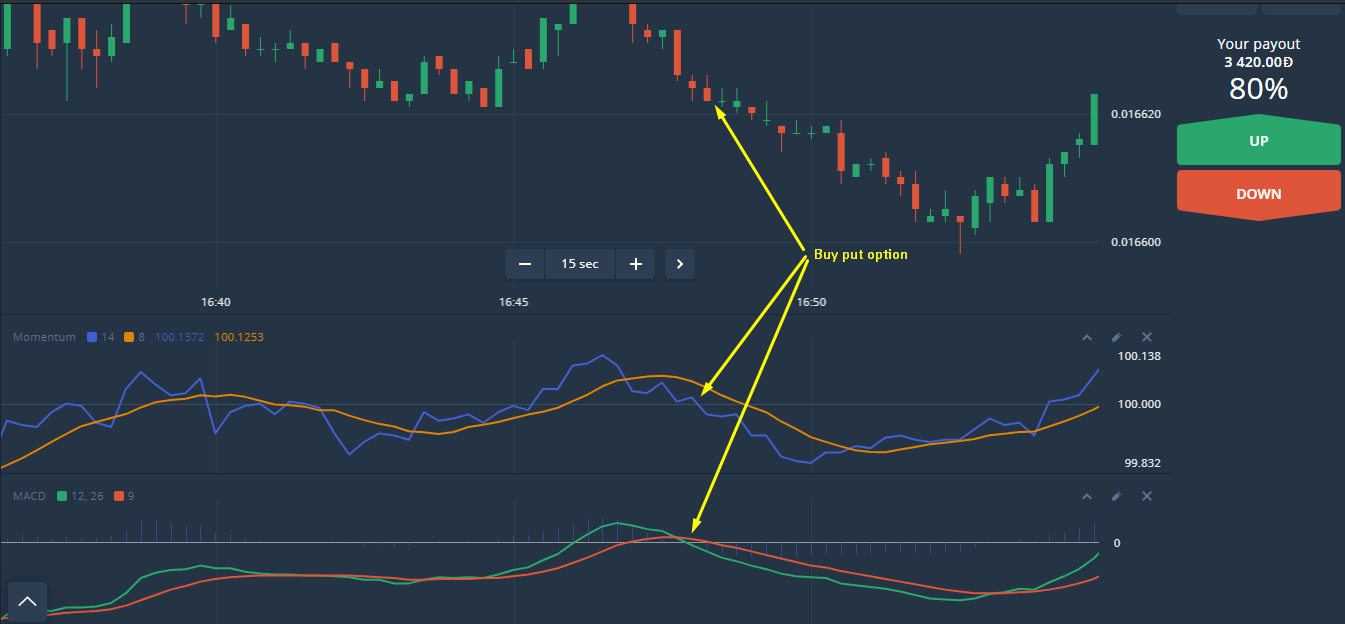
Buying Put option – the intersection of the lines MACD and moving columns in the lower part, as well as the transition of the Momentum curve to the positive plane located in the upper part of the window.
Trades “up” should be opened when the MACD Moving Averages are below the zero border. For contracts “down,” the situation is reversed. Only those reversals that occur in the lower half of the indicator window are taken into account. We emphasize that we are talking about the position of the line relative to the OverBought and OverSold zones, not the color or arrangement of the columns of the histogram.
Conclusion
There are several ways to reduce the number of false signals when trading on the strategy. First, you need to visually assess the chart. If there is frequent alternation of red and green candles and the quotes remain at approximately the same level, then this is a horizontal trend. Other indirect signs will also point to it: a decrease in the distance between the 100 border and the Momentum lines, and the MACD.
A low deviation factor for the Moving Average is also a negative sign. This is easy to determine by paying attention to the height of the columns of the histogram. All these indicators are relative, so they should be assessed based on the historical data of a specific asset chart in the past, where periods of pronounced trend movement were recorded.
The second important aspect is the number of MACD intersections per one overbought or oversold session. In this case a “session” is a period when the Moving Averages cross the zone border (100). For example, if the MACD has already managed to reverse 2 times while in the overbought area, then the probability of a false signal on the third increases significantly.


